Balance sheet report
The Balance Sheet shows what your business owns, what it owes, and what is left over for the owners — all as at a single date. Alongside the Profit and loss report (which covers a period), it is one of the two core financial statements.
Before you begin
- Sign in and select your organisation. The report is available on every plan.
- Figures are shown in your functional currency.
- The report is built from your posted general-ledger journals. Draft documents are not included.
Open the report
- Go to Reports and, under Financial, open Balance Sheet.
- The report opens as at today. To see the position on another date — for example your financial year end — pick a date in the As at box and choose Apply.
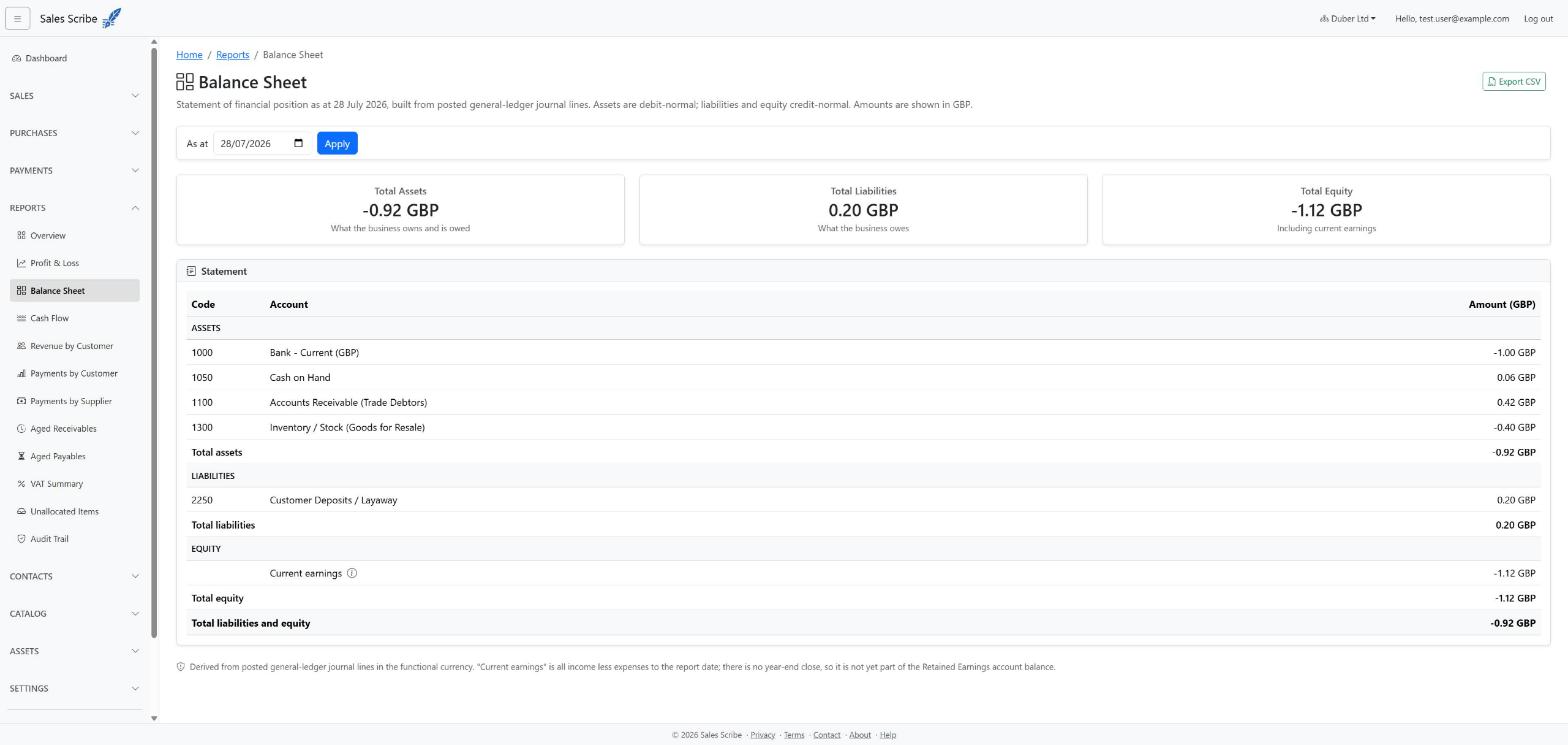
How to read it
Three summary cards give you the headline position:
- Total Assets — what the business owns and is owed: bank and cash balances, money due from customers, stock, and so on.
- Total Liabilities — what the business owes: supplier balances, VAT due, credit-card balances and other debts.
- Total Equity — what belongs to the owners, including profits the business has kept.
Below the cards, the Statement lists each account with a balance, grouped into Assets, Liabilities and Equity, each with a section total. Accounts with a zero balance are hidden, unless the comparative column has a balance for them.
Once your financial year end is recorded, a Comparative column shows the position at an earlier date: the previous year end, or, part-way through a year, the day before that year began. Each column places an account under the heading its own balance puts it, so an account can appear under two headings with a dash in the year it was not there. See Comparatives.
Accounts that move section
Some accounts are presented according to their closing balance rather than their account type, and carry a reclassified badge when they do:
- An overdrawn bank account presents as a liability, not as a negative asset.
- A credit card in credit presents as an asset, not as a negative liability.
- A director's loan account presents on whichever side its balance puts it — see below.
Two things deliberately never move. Equity always stays in Equity: accumulated losses are negative equity, not something the business owns. And physical cash always stays in Assets — a till cannot legitimately hold a negative balance, so instead of dressing the error up as an overdraft the row is badged check this balance and left where it belongs.
Directors' loan accounts
Running accounts held by a person are listed together at the end of their section under one heading — Directors' loan accounts, or Members' loan accounts / Partners' current accounts depending on your legal form — with a row per person and a subtotal.
- Each person is shown in full. Balances on opposite sides are never netted against each other: if one director owes the company and another is owed by it, you see both, on both sides.
- The heading is a presentation grouping, not a new level in your chart of accounts.
- Each row is named with its holder and their standing as at the report's As at date — so a balance sheet for last year reads as it did then. A former director appears as Director's Loan – George Smith (former director).
Drill into any of them from the person's page via the loan account statement.
The earnings lines
In the Equity section you will see up to two lines that are not ledger accounts. What they show depends on whether you have told Sales Scribe your financial year end.
With a financial year end set:
- Earnings brought forward — profit or loss from financial periods before the one you are in. The line is hidden when it is nil in both columns, so you will not see it in your first period.
- Current earnings — Year ending 31 March 2027 (or whatever your period is called) — profit or loss for the period you are in, up to the report date.
Without one:
- Current earnings alone, meaning all profit or loss to date. This is what the report has always shown, and it is the same figure a Profit & Loss covering all time would give as its bottom line.
When the date falls in a finalised year
If the report date is inside a financial year that has been finalised, a notice above the statement says so: who signed it off, when, and which revision. If entries dated inside that year have been posted since, the notice becomes a warning — the figures below are the ledger's, not the ones that were signed off — and shows the profit that was signed next to what the ledger says now.
Nothing is "closed" into Retained Earnings
There is no year-end closing journal, and this is deliberate. A closing entry would zero your income and expense accounts, which means every report summing those over a date range that straddles a year boundary — a rolling twelve months, a management P&L, a drill-down across the boundary — would have to know to leave the closing entry out. Miss one and the report is quietly wrong rather than obviously broken.
Working the figures out from your ledger each time avoids that, and has a useful side effect: a late entry dated into an earlier period corrects both lines by itself. Nothing needs re-running.
The Retained Earnings account keeps its own row with its own code, as an account. Its balance is whatever has been posted to it directly — most often opening reserves brought in when a business moved onto Sales Scribe from another system. The account row and the two lines together are your total retained profit.
The statement always balances
A balance sheet must satisfy the accounting equation: Assets = Liabilities + Equity. Because every journal Sales Scribe posts is checked to be balanced, this always holds — the Total liabilities and equity figure at the bottom always equals Total Assets. If it ever did not, the report would show a prominent red warning rather than hiding the difference; if you see that warning, contact support.
Where the figures come from
Each account's balance is the sum of every posted journal line on that account up to (and including) the As at date, in your functional currency. Reversed postings (for example a voided invoice) are netted off by their reversal journals.
Export
Use the CSV button to download the statement — each account row appears with its section, group, code, name and amount, followed by the section totals.
The Group column carries the directors'-loan heading, and each section that has one gets its own subtotal row, so the per-person breakdown survives the export rather than existing only on screen.
The earnings lines are exported too, named as they appear — including the period, as in Current earnings (Year ending 31 March 2027) — so a file read months later still says which year it covers.